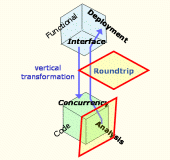
Figure 9.1:
Analysis and Round-Trip
Engineering
9. Analysis and Round-Trip Engineering
In the current release of the HRT-UML/RCM tool-set feasibility analysis and sensitivity analysis are performed by MAST+, an enhancement of the MAST analysis utility developed at the University of Cantabria, Spain [UCA04]. In order to integrate MAST+ in the HRT-UML/RCM tool-set, we had to transform the Concurrency View to a model view which could be accepted by MAST+ (in fact by plain MAST since the MAST+ upgrade did not modify the input/output components of the original utility): what happens in practice is that a further instance of model transformation takes place from the RCM metamodel (which underpins HRT-UML/RCM) to the MAST+ metamodel and backwards.
The Analysis View is the place where the system model is described in terms of the MAST+ formalism. Although the model represented in the Analysis View need not be transformed into source code targeted for any particular platform, the information used to build it is platform-specific, and thus the Analysis View is part of PSM. The Analysis view abstracts away the details which are not relevant to its intent and purpose. For example, the system model is reduced to the instance level. Accordingly, the results of the analysis are reported back to the individual instances of the system, in every applicable view.
Once the relevant information is imported from the Concurrency View and the MAST+ model is constructed, the analysis is performed, and the Analysis View is decorated with its results and the new information automatically propagates throughout the entire model, thereby decorating the Concurrency, Interface and Deployment Views. This back propagation is part of the essential mechanisms of round-trip engineering. Some results of the analysis are placed back on individual ports and on the port clusters which are attached to VMLC instances (and then to the originating APLC); others are attached to partitions and logical connections. In the following we enumerate a few examples of the information reported back from the Analysis View:
- For a cyclic task (as in the PRO threaded VMLC): maximum blocking time, maximum feasible WCET, minimum feasible period, OBCS ceiling, priority, task ceiling, worst-case response time
- For a sporadic task (for the Dispatcher threaded VMLC that realizes the Dispatch operation of the TMTC APLC): maximum blocking time, maximum feasible WCET, minimum feasible inter-arrival time, minimum inter-arrival time, OBCS ceiling priority, thread priority, worst-case response time
- For a protected resource (e.g. POS): ceiling priority
- For a passive resource (e.g. GNC): no return information.
The Partitioned Toy Example: Round Trip
In its current release MAST+ does not fully support
distributed
analysis as yet (but work is in progress to incorporate this feature).
Accordingly this Tutorial
cannot show and discuss the proceedings of the analysis of the
Distributed Toy Example. We
shall therefore limit ourselves to presenting the analysis of the
Partitioned Toy Example. The Tutorial will be completed with the
missing information before the end of the project.

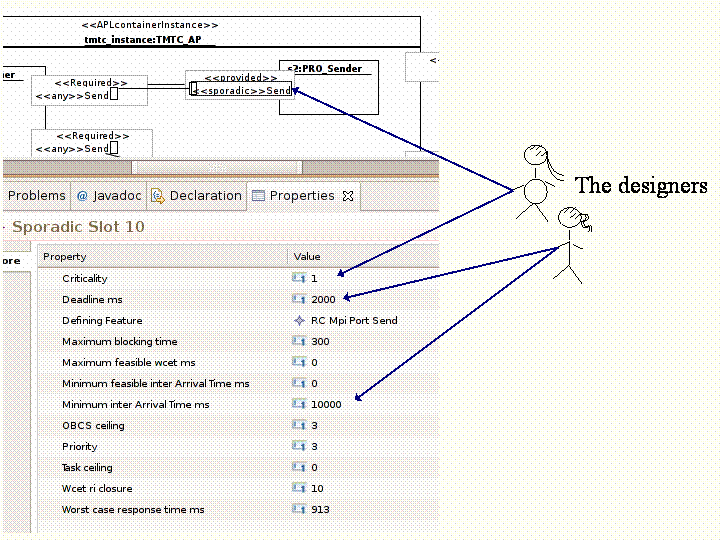
Figure 9.2: Sample of results from the feasibility analysis
Figure 9.2 shows the results of the analysis performed on the TMTC APLC of the Partitioned Toy Example. The top of the figure shows an instance of TMTC APLC, whereas the bottom part of the figure reports the results of the timing analysis performed on port Send (which is typed Sporadic). The designer has set those values pointed to by the side arrows: the criticality level to 1; the deadline to 2,000; and the minimum inter-arrival time between any two subsequent activations of the deferred operation Send, to 10,000 units of time. The other values represent the results of the analysis. A simplified description of the measured attributes follows:
- maximum blocking time
- the maximum time during which a task Ti can be blocked because of the priority inversion incurred on application of the priority ceiling emulation protocol.
- maximum feasible WCET
- threshold of the maximum duration that the execution of the provided operation may take including the cost of any immediate operations invoked by the RI exposed by that operation. The system is feasible (timely) as long as the time cost of that provided operation does not exceed the reported threshold.
- minimum feasible inter-arrival time
- the minimum time span that must occur between any two subsequent activations of the thread that execute the designated set of deferred services.
- OBCS ceiling [priority]
- attribute of the synchronization agent used by the RCM Virtual Machine for managing asynchronous communication and synchronization between threads.
- priority
- attribute used for FPPS scheduling (Fixed-Priority Pre-emptive Scheduling). The value of this attribute is automatically set by the analysis tool, on account of the criticality attribute set by the designer on the corresponding APLC.
- task ceiling [priority]
- attribute that reflects the preemption level assigned to threads of control subject to EDF (Earliest Deadline First) scheduling.
- WCET RI closure
- maximum duration that the execution of the provided operation may take including the cost of any immediate operations invoked by the RI exposed by that operation.
- Worst-case response time
- maximum time it may take for a thread to complete a job under worst-case activation conditions.
Ongoing work
At the time this report is being written some planned features of the MAST+ analysis tool are not completed as yet. In particular:
- Analysis is not available for distributed systems.
- Analysis of communication bandwidth and memory usage is not available as it needs information specified in the Data View, which is still under development at present.